Measuring Friction on Polywater’s Friction Table
While Polywater uses several friction measurement methods, the friction table is the fastest and most convenient.
Key Takeaways
- How friction is measured using Polywater’s Friction Table device.
- The physics principles that form the basis for the friction measurement.
- Variables that affect friction, including conduit and cable jacket.
- Variation in friction measurement.
- The effect of pulling lubricants on the coefficient of friction (COF).
Measuring Friction on Polywater’s Friction Table
Polywater® has measured the friction coefficient for thousands of cable, conduit, and lubricant combinations using the friction table. Most of our pulling lubricants were optimized using this device.
We work with cable and conduit manufacturers and end users to develop reliable coefficient of friction information. In turn, we have developed an extensive coefficient of friction database. Each published value is an average of multiple tests and represents a broad body of work. Data collected from years of friction table testing are the primary source for the friction database in Polywater’s Pull-Planner™ Software.
| Related Content: Coefficient of Friction in Cable Pulling — Part 1 |
How the friction table works
The basic friction table is diagrammed below:
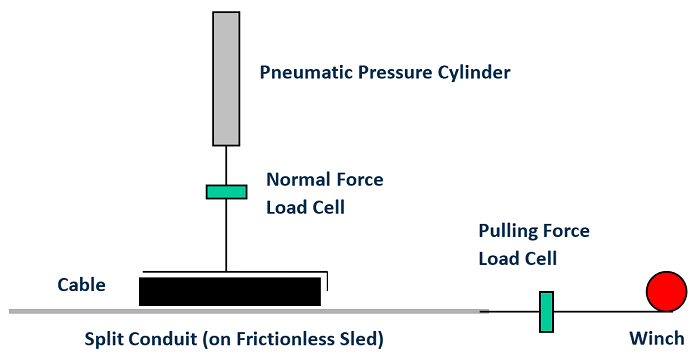
Measurements are made by sliding a 6-inch (152 mm) section of cable over a split conduit. All materials are cleaned, and an unlubricated control is measured. Cable and conduit are coated with a thin film of the lubricant to determine the lubricated COF. If more than one lubricant is tested, cable and conduit are cleaned or exchanged with fresh materials so that the unlubricated value matches the initial control. A pneumatic pressure cylinder pushes down on the cable. A load cell measures this normal force. A small winch pulls the conduit at a constant speed of 23 ft/min (7 m/min). Note that the conduit is pulled under the cable. This makes no difference in friction determination and enables data to be gathered with a relatively small piece of cable. A second load cell measures the pulling force. Both load cell measurements are simultaneously captured by a load cell scale, which takes readings every 0.1 second. The kinetic coefficient of friction is calculated from this data using the equation:
μ = F/N
Where:
μ is the coefficient of friction
F is the measured pulling force
N is the measured normal force
We pull twenty (20) data points from the central part of the test and these are averaged for the final COF value. If the standard deviation is higher than 0.02 lubricated or 0.04 unlubricated, the run is discarded. Recorded results are the average of three or four separate pulls. Actual data used to develop a single COF value are shown below.
Graph 1
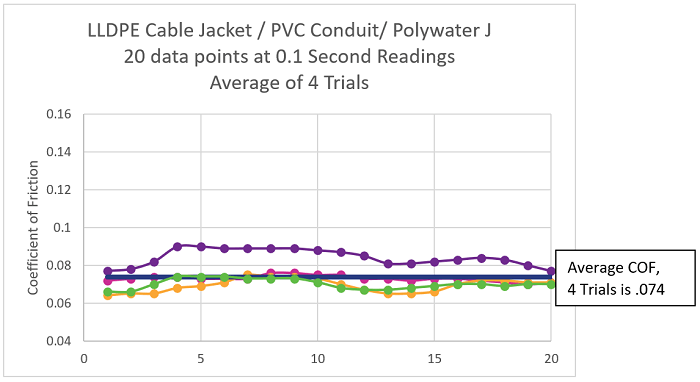
The COF variance within the short pull length and from pull to pull is captured in the graph above and tends to be relatively low.
Kinetic versus static friction
Polywater’s Friction Table is set up to measure kinetic or sliding friction. The discrete data sampling that we record prohibits a determination of static friction. Regardless, kinetic friction results are the most useful and provide the best correlation with measured tension in field cable pulls. Some “non-lubricated” jackets show a significant variation between the static and kinetic friction, resulting in “slip/stick” (cable jumping) in pulling.
| Related Content: Measuring Cable Pulling Friction with a Reel Test |
Statistical analysis
There is another source of variation that can be more significant. This is the variation over multiple cable jackets in the same generic class. Polymeric jackets can differ in formulation and physical properties from one manufacturer to another. Metal conduits also show higher variance.
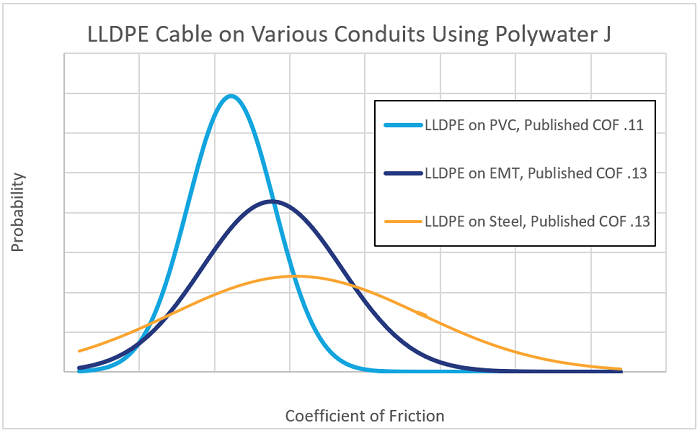
Polywater’s database represents well over a decade of collected data. Variations in individual results reflect the differences mentioned above. As an example, Graph 2 below shows the normal distribution for multiple tests of LLDPE-jacketed cable on three different conduit types. Steel COF data shows a higher data spread than the EMT or PVC conduits.
Graph 2
COF data offered in our literature and Pull-Planner Software represent many manufacturers and products within their grouping. It is important to realize that most friction table data are averages, and variance should be considered when the data are used. Although there is variance across conduit and cable jacket materials, cable lubrication is the biggest differentiating factor as will be shown in the next part of this paper.
General results from the friction table
Analysis and presentation of all the conclusions gathered from the friction table are beyond the scope of this paper. However, some generalized findings are highlighted below.
| Related Content: The Polywater® Friction Table: Personal Perspectives |
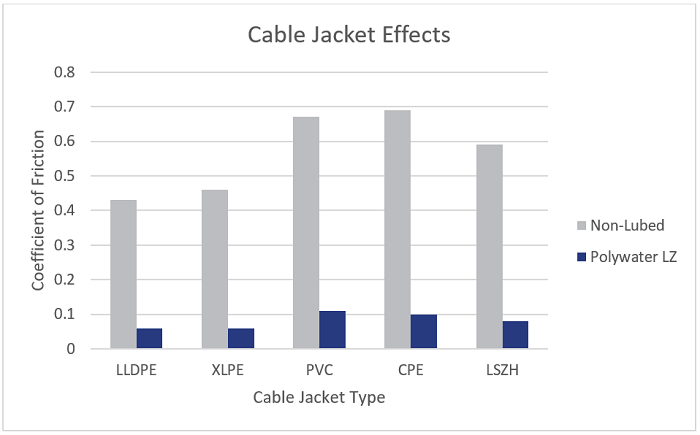
Cable jacket effects
Graph 3 shows average friction coefficients for various jackets in PVC conduit, both lubricated and non- lubricated.
The data show the importance of high-performance lubricants. While unlubricated COF values range from 0.43 to 0.69, Polywater LZ is effective across a broad range of jacket types. The lower COFs possible with Polywater LZ produce lower tension pulls that, in turn, allow longer conduit runs.
Note that non-lubricated friction and lubricated friction vary by jacket. While the high-performance lubricant Polywater LZ is an equalizer, there is still a range in lubricated friction (0.06 to 0.11) among these jackets.
Graph 3
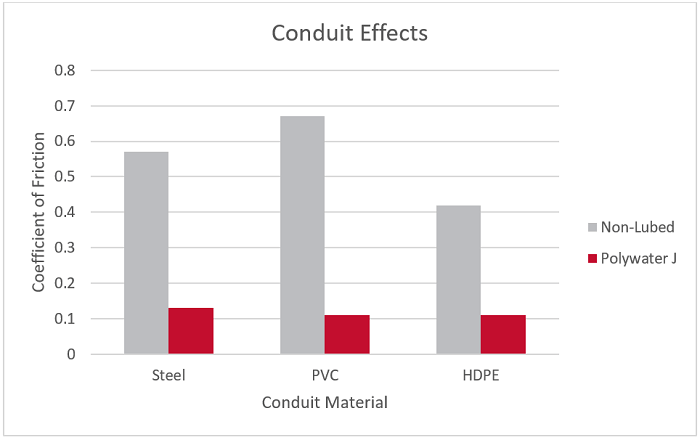
Conduit effects
Graph 4 shows average friction coefficients for PVC jacket in several types of conduit, again both lubricated and non-lubricated.
As expected, non-lubricated friction is several times higher than lubricated (0.42 to 0.67). Also note that there is a small difference in lubricated friction based on conduit type (in this case, 0.11 to 0.13).
Graph 4
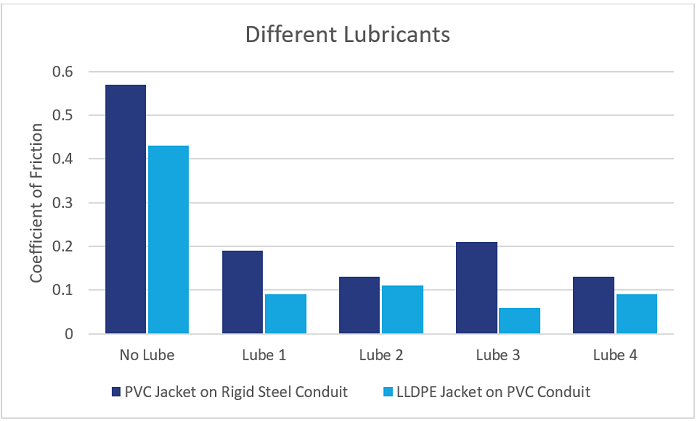
Lubricant effects
Graph 5 shows average friction coefficients for PVC jacket in rigid steel conduit and LLDPE jacket in PVC conduit with different commercially available pulling lubricants. All lubricants reduce friction and show large coefficient of friction differences compared to non-lubricated cable. Lubricant performance is also dependent on materials and the combination of surfaces. Lube 3 shows the highest friction reduction for LLDPE jacket with PVC conduit, but does not perform as well on PVC jacket with rigid steel conduit.
Graph 5
Limitations of Polywater’s Friction Table
While the friction table device has provided enormous insight on the variables affecting friction and tension, there are some limitations in what can be tested on the device. Below, are some of its limitations:
1. The friction table represents a well-lubricated condition. Aspects like lubricant carrying properties cannot be measured on the machine.
2. The device only works with single cable, so variables like cable configuration or multi-size cables cannot be studied. We have performed cable jamming and cable fill studies on other cable friction measurement devices.
3. Certain conditions such as pulling through water-filled duct can be studied through repetitive pulls and comparative friction measurement. While these studies are cumbersome, we have conducted specialty studies, usually with other measurement devices.
4. Small, flexible cables tend to “bunch” and do not give good results on the device.
5. While the friction table can be run in various ambient conditions, its use in hot or cold rooms is not practical, so the data represent typical laboratory temperatures of 68° F to 72° F (20° C to 22° C).
6. While the normal pressure on the friction table can be adjusted, a great majority of the historical data has been taken with a normal pressure in the range of 100 lbs. (445 N). While friction variation with normal pressure can be studied on the device, the use of low normal pressures raises the measurement variance significantly. So, normal pressure effects on friction have been studied using other methods.
| Related Content: FAQ – Cable Pulling, Lubrication, and Tension |
Summary
The Polywater Friction Table offers a convenient and effective way to measure friction. Much has been learned on the device, including a measurement basis for extended pulling distances and lower tensions possible with Polywater Pulling Lubricants. Data derived from the friction table can help plan and optimize cable installation in conduit.