Measuring Cable Pulling Friction with a Reel Test
Polywater’s long-standing reel test, uses a 3-foot (1-meter) diameter wheel to calculate coefficient of friction (COF) in multiple scenarios. How does this large, blue-colored wheel help us as a lubricant manufacturer?
Key Takeaways
- An understanding of the steps involved in measuring friction using a reel type test
- Variations in friction measurement – including cable and jacket materials
- Includes corrugated duct
- Includes variable sidewall
- The effect of pulling lubricants on coefficient of friction
- We look at the benefits of cable lubrication versus using prelubricated duct
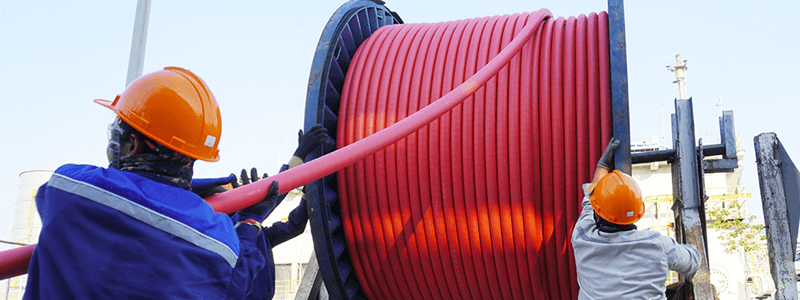
This paper walks readers through Polywater’s long-standing reel test, which uses a 3-foot (1-meter) diameter wheel to calculate coefficient of friction (COF) in multiple scenarios. How does this large, blue-colored wheel help us as a lubricant manufacturer? The reel test has proven to be a versatile method to test the effect of cable fill on cable pulling tension and is particularly useful in analyzing fiber optic cable installation scenarios.
Additionally, this testing method enables us to evaluate a wide range of cable jacket and conduit types. It was instrumental in our recent addition of telecommunications cables and jackets to our database, an industry-wide resource to measure the coefficient of friction for planning cable installations no matter the scale. And, of course, the test is part of making sure that the lubricants we develop undergo comprehensive testing before market introduction. In fact, Polywater® has used this reel test for more than 35 years, so it has played a role in testing the majority of our lubricants.
Tension measurements from this test augment work done on Polywater’s Friction Table. The friction table works on a flat length of innerduct with a measured normal force. The reel test measures tension as the cable moves through curves and bends. In combination, the tests offer valuable contributions to Polywater’s body of lubrication knowledge.
| Related Content: Coefficient of Friction in Cable Pulling — Part 1 |
The reel test works extremely well with lightweight cable designs and continuous duct. This is an ideal test for fiber optic cable. The wrapped design of the test increases tension and produces valid data in a relatively compact space. This test design is recommended by Telcordia, the IEC, and most cable manufacturers.
How the Reel Test Works
In this method, the conduit is wrapped 420° around a 3-foot (1-meter) diameter wheel. A weight (Tin), typically 25 lbs (11.3 Kg), is suspended from a pulley 15 feet (4.6 m) above the pulling plane at a 60° angle. Cable is then pulled by a winch operating at a constant speed of 65 feet (20 m) per minute. A load cell attached to the winch rope measures pulling tension (Tout) every half-second.

The resulting data is fed directly into a spreadsheet that averages the pulling tension and calculates the friction coefficient. Note that the cable is being pulled (moving) when these readings are taken, which represent a “dynamic” friction coefficient. The following formula is used to calculate this dynamic coefficient of friction:
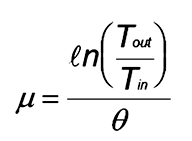
Where:
μ is the kinetic coefficient of friction, COF (dimensionless)
Tin is the incoming tension (force)
Tout is the measured pulling tension (force)
Θ is the total angle of duct around bend or 7.33 radians
| Related Content: FAQ – Cable Pulling, Lubrication, and Tension |
Actual coefficient of friction values obtained in the field may be higher. Numerous factors in the field will affect pulling tension, for example, lubricant application technique, temperature, cable stiffness, percent conduit fill, and any contaminants.
General Results
Analysis and presentation of all data and conclusions gathered from this test method are beyond the scope of this paper. However, our generalized findings are summarized below.
Incoming Tension
This test design does not allow direct variation of the normal (sidewall) force. Instead, incoming tension (Tin) can be varied using different back tension weights. This, in turn, produces a variable pull tension (Tout). Sidewall force is a ratio of the pull tension to radius using the following equation (one cable):
Sidewall Force is
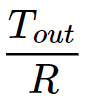
Where:
Tout is the measured pulling tension (force)
R is the radius of the bend
By using a lower or higher incoming tension, the sidewall force is also lowered or increased.
Graph 1 below shows a set of results from a single test group. In this test, Polywater® FTTx Cable Lubricant was used to lubricate a fire-retardant polyethylene fiber cable and an MDPE fiber cable through a continuous smoothwall HDPE innerduct. Tensions were measured with variable incoming tension. The coefficient of friction was calculated from the measured pull tension.

For this test, coefficient of friction is slightly lower under higher sidewall force. This is a usual result based on many iterations of this friction testing. The chart below shows the data and sidewall calculation from the Graph 1 data set in more detail.
| FR-PE Cable | MDPE Cable | |||||
| Tin, lbf (Kgf) | Tout, lbf (Kgf) | Sidewall Force, lbf (Kgf) | COF calculated | Tout, lbf (Kgf) | Sidewall Force, lbf (Kgf) | COF calculated |
| 8 (3.6) | 20 (9.1) | 13 (5.9) | .13 | 19.5 (8.8) | 13 (5.9) | .12 |
| 15 (6.8) | 33 (15.0) | 22 (10.0) | .11 | 28.7 (13.7) | 19 (8.6) | .09 |
| 25 (11.3) | 50 (22.7) | 33 (15.0) | .11 | 45.2 (20.5) | 30 (13.6) | .08 |
As noted, the COF is lower under higher sidewall forces. In some testing, the effect is less dramatic. This test is often run with a variable incoming tension, but COF results under the lower incoming tensions produce higher standard deviation. Typically, results are reported based on the incoming tension of 25 lbf (11.3 Kgf).
| Related Content: Measuring Friction on Polywater’s Friction Table |
Cable Jacket Effects
Graph 2 displayed below shows average friction coefficients for various cables pulled through a smoothwall polyethylene duct using both lubricated and unlubricated cables. These data show that COF is dependent on surface materials. High-performance lubricants are effective across a broad range of materials. For these data, lubricated COF values fall within a narrow range of 0.09 to 0.11 while the unlubricated values fall into a much larger range, 0.22 to 0.35. The lower COF when lubricating the duct facilitates lower tension pulls, so that conduit runs can be longer with fewer splices.

Conduit Effects
Graph 3 measures the COF in both smoothwall and corrugated HDPE. In this test, the different styles of conduit have minimal impact on the COF. Lubricant use is the biggest factor in lowering COF. Polywater CGL is a thicker gel lubricant and, in this testing, is less effective in corrugated conduit. Polywater FTTx is a high-performance, thin-film lubricant and has excellent friction reduction in both smooth and corrugated duct.

Lubricant Effects
Below, graph 4 shows the average friction coefficients for MDPE jacket in smoothwall polyethylene conduit with different pulling lubricants. All lubricants reduce friction and show large coefficient of friction differences compared to the non-lubricated control. Any of these lubricants work well to lower friction. While lubricant performance is dependent on material combinations, high-performance lubricants are generally effective across a broad selection of jacket styles. Lubricant choice will include raceway design and application considerations. The different lubricants tested reflect a range: pourable, stringy gels, thick gels, and sprayable thin-film liquids.

Prelubricated Ducts
Polywater lubricants are compatible with prelubricated ducts. Graph 5 compares standard and prelubricated ducts. While prelubricated ducts produce lower COF values, Polywater lubricants such as Prelube 2000™ are extremely effective at lowering friction. In this case, Prelube 2000 “levels the playing field.” With Prelube 2000, both the standard conduit and the prelubricated conduit produce the same COF.

Summary
Our long-standing reel test works well for lightweight cables and has proven to be a versatile method of measuring the effect of cable fill on cable pulling tension. It is particularly useful in analyzing fiber optic cable installation scenarios while supporting the development of Polywater’s family of communications lubricants. Friction data resulting from this test can be used to plan and optimize cable installation in conduit.
| Related Content: The Polywater® Friction Table: Personal Perspectives |
Bibliography
International Electrotechnical Commission, “IEC/TR62470 Technical Report, Guidance on Techniques for the Measurement of the Coefficient of Friction (COF) between Cables and Ducts” Edition 1.0, Geneva Switzerland, October 2011.
Telcordia “Generic Requirements for Optical Cable Innerduct, Associated Conduit, and Accessories” Issue 2, Piscataway, NJ, June 2009
The Effects of Conduit Fill on Premises Cabling