Mapping Transformer Populations
A key to optimize transformer maintenance processes in order to minimize risks and costs.
Key Takeaways
Mapping is a robust, proactive process that provides an overall picture of potential risks and worst-case scenarios to identify actions to be taken to achieve the economic and operational objectives of a transformer population.
Abstract
This article introduces a model for mapping transformer populations. The concept of mapping goes beyond a transformer condition assessment to include the financial risks of power disruption and downtime. Different power plant types or industrial production facilities can experience significant cost increases due to production downtimes from the loss of all or part of a transformer population. Even a single day or a few hours of lost power can have a severe economic impact depending on the function of the transformer(s). The mapping process must be modified to account for these differences.
1. Introduction
The compelling necessity for maintenance is often highlighted in papers about transformer operations. In many cases operators take ineffective actions, like regular oil purification, in the hopes of fulfilling maintenance requirements. Much money can be spent on such unnecessary actions resulting in wasted and misallocated maintenance resources and taking funds away from truly necessary maintenance procedures. Only condition-based maintenance optimizes the viable processes from both technical and economic standpoints.
Transformer mapping must be used as a starting point for condition-based maintenance to define the actions needed to ensure the reliability of a transformer fleet’s performance. While the mapping process will follow the same steps, transformer type and function determine which steps are more critical than others in any particular situation.
![]() This article provides the steps necessary to reach the target of full plant reliability and the ability to target capital requirements, including the following goals:
This article provides the steps necessary to reach the target of full plant reliability and the ability to target capital requirements, including the following goals:
- Detailed description of mapping and why it’s important,
- Explain the differences and why stronger emphasis is placed on different steps of the mapping process based on transformer type and function, including: transmission and distribution (T&D) transformers, industrial transformers and power plant transformers.
- Provide step-by-step mapping processes comprising eight steps, and
- Follow the mapping steps to map a 36-year-old German power plant and pinpoint those actions most critical to meeting the operational and financial objectives of the plant.
| Related Content: Mapping as Risk and Cost Assessment Methodology |
2. Mapping requirements by transformer type
2.1 Transmission and distribution transformers
Distribution and transmission grids typically have large transformer reserves and redundancies. Therefore, the reliability of individual transformer operations is not necessarily a top priority. Mapping of distribution and transmission grids addresses issues such as the behavior of existing equipment when exposed to load increases, the creation of a long-term fallback strategies, and the prioritization of additional transformers in case of future load increases. A worst-case appraisal also includes assessing the risk of an unplanned interruption of operations and defining the necessary steps to be taken in the event of transformer failure.
2.2 Industrial transformers
For industrial applications, reliability of operation is a much higher priority and requires analysis of key assets to avoid costly downtimes and the loss of production capacity in the plants. In these cases, appropriate asset preservation and fallback strategies must be developed to avoid such costly failures with the maximum degree of certainty.
2.3 Power plant Transformers
The most critical application of mapping can be found in power plants where a single day of lost transformer performance can lead to huge monetary losses. In these cases, the definition of key assets must be made with particular care. Although the generator transformer is the key asset, other critical assets can include anything that, if it failed, would lead to an unplanned interruption of operations. For this purpose, all transformers incorporated into the generator bus bar, such as auxiliary units, must be considered. Additionally, the term ‘key asset’ may include other ancillary systems such as condensate pumps, coal cranes and flue gas treatment systems.
| Related Content: Transformer Leak Repair Story from Polywater® |
3. Step-by-step mapping processes
A well-defined mapping procedure must be designed to generate an actionable information base from which to improve the reliability of a transformer fleet and associated assets. Mapping must define all future planning and optimization procedures to maximize transformer performance and return on investment (ROI). This mapping process should also consider future growth of demand on the system in question.
The steps in the mapping process are:
-
1. Statement of Objectives
The objectives of the mapping exercise must be relevant to current and future situations and are best formulated by a multi-functional team. The identification of both operational and economic objectives must be defined in this first step of the mapping process. These include, but are not limited to production capacity, timing and budget objectives.
2. Data collection and Documentation (Assessment)
The collection of pertinent data on the operating condition of the transformer(s) and ancillary equipment establishes an objective basis from which to ascertain the past performance history of the asset(s) in question. This data can reveal environmental and operating factors to which the transformers have been exposed. A complete history of the following data should be made available:
-
- Dissolved Gas Analysis (DGA) of 7-9 gases including N2 and O2
- Oil data: i.e., acidity, water content, Breakdown Voltage (BDV), Tan Delta, and Interfacial Tension (IFT)
- Furans
- Inhibitor content
- Other data about maintenance, failures and repairs (including repair technologies used)
- Independent reference sampling
-
3. Diagnostics based on the data found in step 2.
The data collected in Step 2. are analyzed to determine which factors may have compromised the performance of the transformers. These include aging accelerators such as high temperature, moisture, oxygen and acids. Design factors such as cooling technologies are also evaluated at this stage.
- Aging condition
- Design evaluation:
- Load capability
- Remaining substance
- Possibility of Advanced Breakdown (PoAB) factor
- Remaining reliable lifetime under present conditions
-
4. Risk assessment of individual and ancillary assets:
Once the diagnoses of Step 3. have been made, the risks associated with the aging and design condition of the units can be estimated. Weighted risk factors associated with individual transformers, ancillary systems such as auxiliary transformers, condensate pumps and related equipment are also estimated in this step. These risk assessments are summarized below:
- The risk generated by individual units themselves
- The risk generated by ancillary or back-up equipment
- Consequential risk for the plant
-
5. Classification of the units based on priority-of-importance criteria
Step 5 is the key step in any mapping effort. Based on the weighted risk factors established in Step 4. critical assets are classified as key assets and ranked according to their impact on overall risk to the entire operation. In some cases, key assets are ranked below ancillary equipment due to their critical nature. The classification process must identify the following:
- Key assets
- Less impact on reliability
- Future planning of the customer
 6. Preventative and remedial measures
The necessary actions needed to ensure the production capacity, timing and economic objectives established in Step 1 are identified in this step. These actions can include remedial steps to reduce oxygen or moisture in the system or process changes to increase monitoring/sampling frequency. The type and duration of the needed preventative and/or remedial actions are specific to the function, remaining lifetime and operating history of the assets involved. They can be categorized as follows:
- No action required
- Partial action required
- All possible actions required
-
7. Cost estimates for preventative and remedial actions
The financial resources needed to implement the Preventative and Remedial actions must be estimated. Annual expenditures must be identified for on-going measures until such time the assets will be taken off-line, replaced or the plant closed.
8. Long-term remediation plan that includes costs
The final step in the Mapping process is to reach agreement on the actions to take to accomplish the objectives defined in Step 1. of the process. Timelines, costs and responsibilities for the Long-Term Remediation Plan are Key Performance Indicators for its successful implementation.
| Related Content: Cost Effective On-Site Leak Repair of Power Transformers |
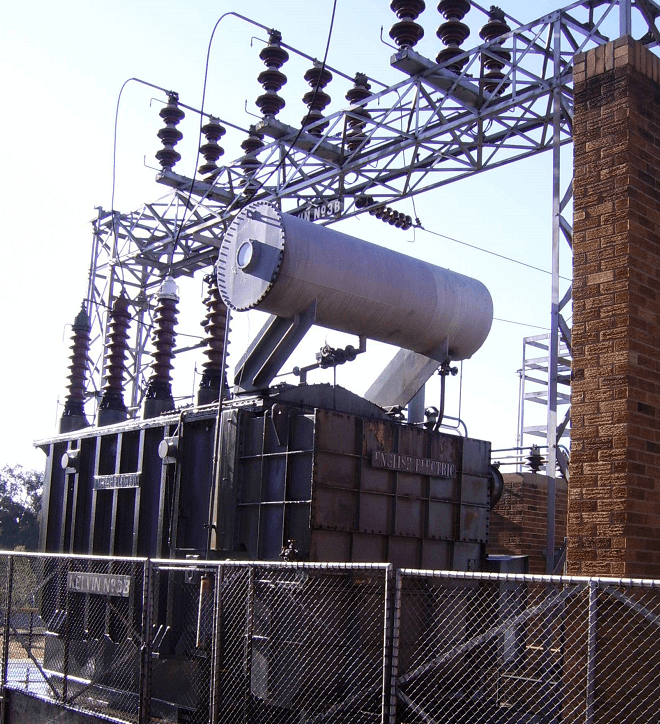
4. Scenario: mapping of auxiliary transformers in a power plant
A scenario described below will be used to show how each step of the Mapping Process was used in a real-world situation. In this case, mapping auxiliary transformers in a German Power plant. The factors most important to this operation and the steps required to meet the operating and economic objectives of the plant are reviewed and quantified.
The auxiliary systems in a power plant are supplied by a medium voltage system mostly 10 or 6kV. Under normal operating conditions this system is supplied by the unit auxiliary transformers, which are connected to the generator bus bar. If the plant is in operation, all auxiliary power is delivered by these transformers and therefore no external supply is necessary (in our case 40 MVA 20/10,5/10,5 kV). These transformers must be regarded as key assets, because in case of a failure or repair the entire plant must be shut down resulting in loss of production.
The second source is an external supply, fed by the outside grid (in our case 110/10,5/10,5kV). This supply is needed in case the generator is not in service or the bus bar is not energized. It is also needed to restart the plant after any outage. Since these transformers have enough redundancy, they cannot be regarded as key assets. Therefore, the priority for any maintenance or improvement is on the side of the unit auxiliaries, because their breakdown means shutting down the plant and a loss of production.
Location: German Power plant
Manufacture: East German
Years of operations: 36
Rating/Volt: 40 MVA 20/10,5/10,5 kV or 110/10,5/10,5
Type: Unit auxiliary or outside supply
Additional: Dyy5 ONAF or Yyy0 OFAF cooling OLTC
-
-
1. Statement of objectives:
The auxiliary transformers in the power plant had to be mapped and a preventative maintenance plan proposed. The goal was to determine the remaining lifetime of the transformers, work around a planned shutdown of the complete plant and control costs.
The primary economic objective was to reduce any reinvestment in the plant which had a limited remaining lifetime. In addition, any premature break-down had to be avoided. The overall condition of all units could be determined by developing a condition profile.2. Data collection and documentation:
The overall condition of all units had to be determined by developing a condition profile for each auxiliary transformer. Since the customer had a comprehensive and accurate data history, the condition of the transformers was easily evaluated. When evaluating the data, it was discovered that the De-polymerization (DP) values were low. A dissolved Gas Analysis (DGA) showed no negative consequences, except for high O2 values, and Water in Cellulose (Cp) values were less than 2%. The furan content in oil was found to be below detectable levels.
3. Diagnostics:
Using the mapping method, the data from Step 2 was used to assess the aging condition of all the units and evaluate the adequacy of their design. No heat-generated hydrocarbons were found in the DGA suggesting that the load capacities of the transformers were good. The high O2 suggested that the transformers might be reaching their lifetime limits. The low furan levels supported this conclusion, as they were not produced due to low loadings and/or due to oil purification where the furans were removed. No remarkable design defects nor tank leaks were found.
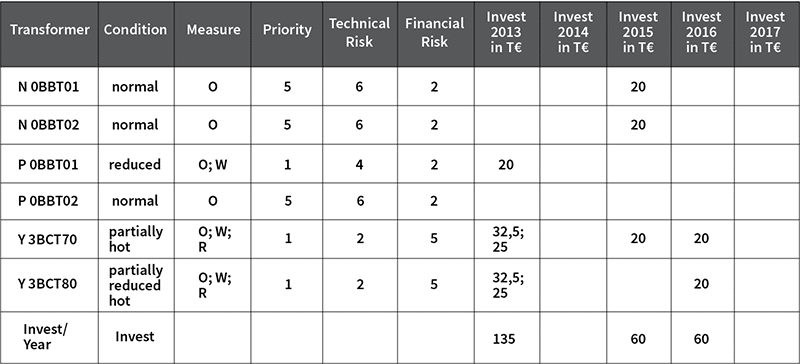
4. Risk assessment:
The next step of the mapping process is to establish a weighted risk of every unit in the plant and record this information (outlined in table 1).The units that posed a higher risk in the system were weighted more heavily, even if their condition was not categorized as severe.
5. Priority of importance criteria:
The substation auxiliaries were the assets with the greatest risk. They supply electrical loads to the transformer cooling systems, oil pumps, load tap changers and other key equipment. Failure of the auxiliaries were key because the failure of these transformers meant an unplanned shutdown of the complete plant. Table 1 shows these transformers as the highest priority, even though their condition was not as critical as the external supply transformers.
Table 1. Action plan with evaluation prioritized by risk (O – Oxygen, W – Water reduction, R – Regeneration)
-
-
6. Preventative and remedial measures:
Various measures were proposed for each auxiliary unit. These fell into three categories of actions: Oxygen Reduction (O), Water Reduction (W) and Regeneration (R). Specific actions included sealing the transformer to prevent moisture ingress, shortening of the sampling cycle, and drying oil changes were recommended. (Table 1)
-
7. Cost estimates for each option in step 6:
Cost estimates for the recommended remedial measures were made.
8. Long-term remediation plan:
The final step in mapping was to define remedial steps to be taken so that all units could function until the planned shut-down of the entire plant. The table integrates the technical and the financial facts as a base for the planning of actions and budgets.
Related Content: How Oxygen and Acids Influence the Aging of Transformers Conclusion
In this article, the transformer mapping process was presented. A detailed example of how this process was used to assess the risks and potential economic consequences of failures of the auxiliary transformers in a German power plant. The mapping process describes the consequences and necessary actions required to mitigate risk and to ensure the plant’s continued operation until its planned shut-down. The necessary steps and data were listed in order to reach this goal.
As described, an initial assessment is made of the transformers in the plant which leads to diagnoses and from the diagnoses the necessary preventative and remedial actions are identified. Mapping is a complete process, where assessment is only the first step of a holistic mapping plan. In future articles, we will provide additional case studies that illustrate how transformer fleet mapping can be used to effectively manage the preventative maintenance and planning involved in maintaining power transformers and distribution transformers.
Have any questions?
This article was originally published in Transformers Magazine, and is republished here with permission.
-